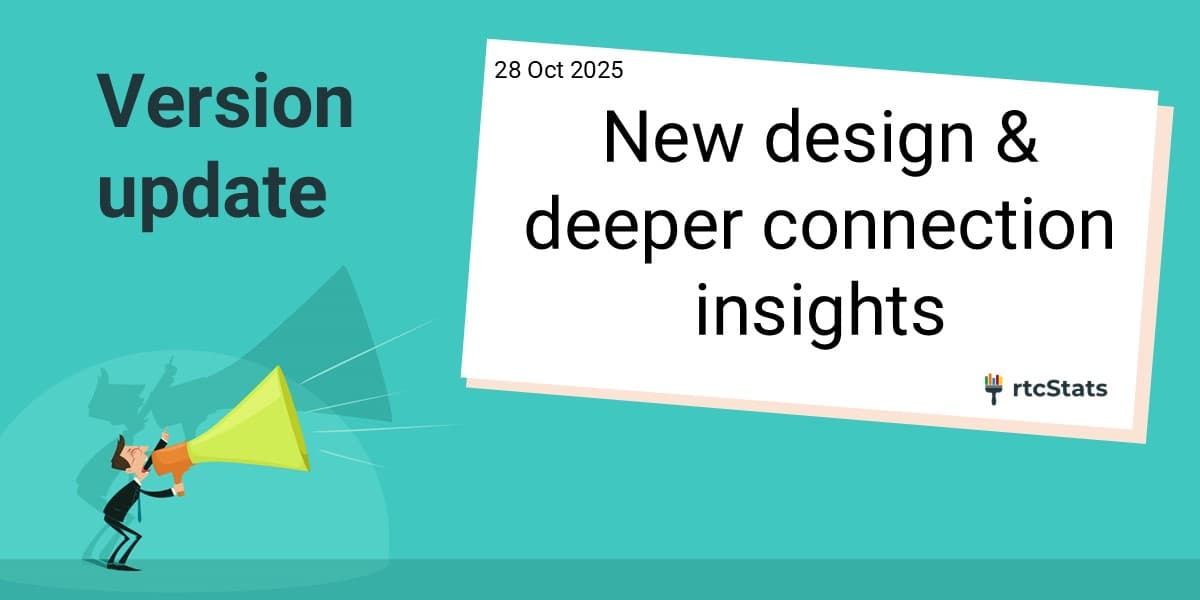
October Updates (2): A new design and connection insights
Complete redesign of the Internals page into focused panes, new connection setup observations, and improved user experience.
Posted by
Related reading
June Updates v1.7: Client Insights, a Dedicated API Host & Smoother Onboarding
rtcStats v1.7: a client-focused Devices page with summary widgets, a dedicated api.rtcstats.com host with an observations catalog, and smoother onboarding.
June Updates v1.6.0: Analysis Page Revamp, Rich API Filters & PC Security
Version 1.6.0 revamps the Analysis page with new stat cards and filters, brings rich filters to the public API and MCP, and adds deeper peer connection security visibility.
May Updates v1.5.0: Geolocation, Website Revamp & New Observations
Version 1.5.0 brings server geolocation in connectivity diagrams (rtcstats), a refreshed website with Open Source and Resources pages, and new observations.
We are excited to announce our latest release 🥳
This update is packed with significant changes, headlined by a major redesign of our Internals page to help you find and debug issues faster. We've also added a powerful new set of observations aimed directly at the connection setup phase - one of the most critical parts of any WebRTC session.
Let's dive in 🤿
🚀 Major Improvements
> A Fresh Look: The New Internals Panes 🥸
The biggest change you'll notice is the completely redesigned Internals page. As we've added more monitoring capabilities, the page was becoming dense and required a lot of scrolling to find specific data. And one thing we hated was having an infinite scroll of death - our sole purpose is to make your life easier - not harder.
To address this, we've split the page into five focused panes:
- Overview: Your starting point for the high-level summary including the observations
- Connections: A dedicated view for everything related to peer-to-peer connection status, including ICE Connectivity and DTLS
- Streams: All your media stream (audio/video) metrics in one place as well as the Data Channels.
- Devices: Information on the capture and output devices being used
- Logs: A focused pane for raw event logs
This new tabbed design allows each section to provide more detailed information without overwhelming the user. You can now jump directly to the area you need to investigate.
It also helps on page loading speeds and direct linking.
 New Internals panes design
> New Connection Setup Observations 🔍
Hand-in-hand with the new "Connections" pane, we're introducing five new observations to help you diagnose setup issues. Failures or delays during the connection phase are notoriously difficult to pinpoint. These new observations target the most common failure points:
- DTLS failure
- Slow DTLS
- Long connection time
- ICE (failures and delays)
- Connection Warmup
These observations allow you to quickly see if something goes wrong during the connection process.
We also added a special observation to indicate when we have detected missing information. This happens when you open the webrtc-internals page too late. Better know about it early on…
 Connection setup observations
✨ Other Improvements
As usually, we've had some other improvements done here and there around our service:
> Improved Invite Flow
We've added a small but significant quality-of-life improvement. Now, when you sign in, any existing invitations tied to your email will be displayed directly on your dashboard. You can accept them with a single click, removing the need to dig through old emails.
 Improved invite flow
> NextJS Migration
Finally, from a technical side, we migrated our stack to the latest NextJS 16.0. This keeps our platform modern, performant, and secure, allowing us to build and iterate faster. This also provides faster rendered pages.
🔧 Important Requirement
> Chromium M143 Support
We've updated our parsers to take into account the new event names (e.g., on...) introduced in WebRTC Internals starting with Chrome M143. This ensures we stay in sync with the latest browser changes.
We're confident that these new features and improvements will help you diagnose and resolve WebRTC issues more effectively. We're always eager to hear your feedback, so please don't hesitate to reach out and let us know what you think of the new release.
