Embeddable viewer
Embed rtcStats session analysis directly in your own dashboard or support tools.
The embeddable viewer allows you to display rtcStats session analysis directly within your own application, dashboard, or support tools - without requiring users to switch to a separate browser tab.
This feature is available on the Enterprise plan.
Overview
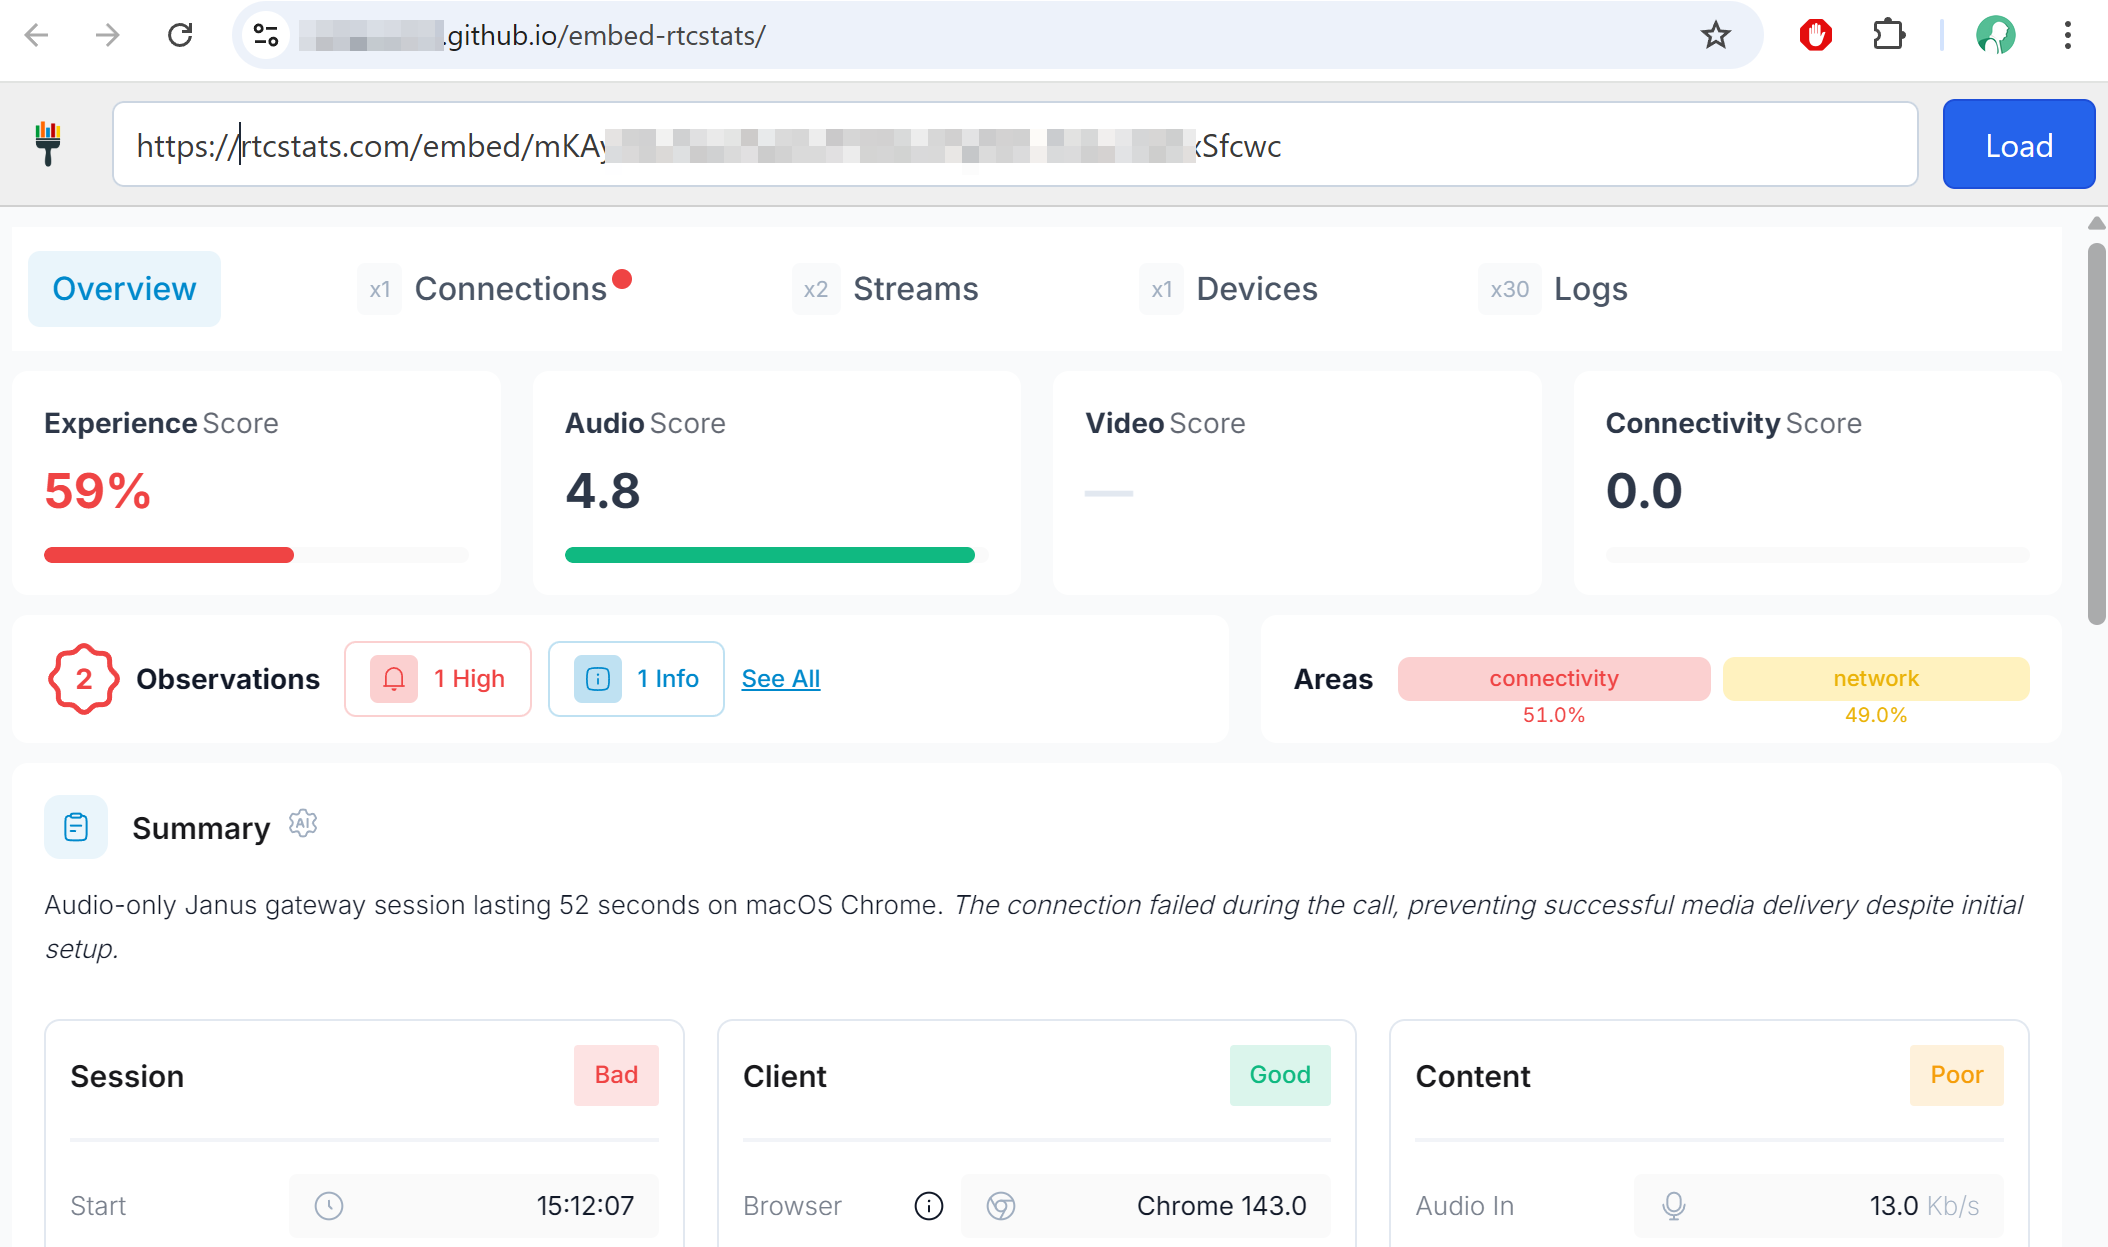
An embeddable viewer enables you to look at a given rtcstats or webrtc-internals file that was uploaded to rtcstats.com inside your own dashboard, without needing to login or even open the rtcstats.com website.
It is useful in two main scenarios:
- You want to reduce the clicks your IT needs to investigate an issue, and you have an existing monitoring dashboard you use today. For you, the visualization of WebRTC related information is part of a bigger picture that you are already handling elsewhere
- Your customers (other businesses) want their own dashboard to be able to review media quality issues on their own. This is quite common in cloud contact centers today as an example
How it works
The embedding uses a URL for the session that is loaded into an <iframe> in your dashboard.
How you obtain that URL depends on whether you integrate over the REST API or with rtcstats-js and rtcstats-server.
Using the rtcStats API
From your backend, use a Bearer token (got from your rtcstats account) and call:
POST /api/rtcstats/v1.0/uploadto upload your sessions.GET /api/rtcstats/v1.0/sessionsto retrieve the list of sessions.- Then load the iframe by setting its
srcto the value of theurlfield from the session (Each session includes thisurlfield).
Note: Call these APIs from your backend.
Here is the complete flow:
Using rtcstats-js and rtcstats-server
Here you typically don't call any API from your backend. The browser sends the statistics via rtcstats-js to your rtcstats-server, which collects and communicates with rtcStats.com and then stores all metadata from your sessions (including the URL in your database). Your dashboard requests your backend for this information and finally loads the iframe the same way as in the API flow.
- rtcstats-js && rtcstats-server store the sessions to rtcstats.com and then the associated metadata to your DB
- Your backend retrieves the list of sessions from your DB
- Your dashboard can then load the iframe with this information
Note: Update your rtcstats-server config file to connect to rtcstats.com
Choosing a path
- rtcStats API - If you want to use rtcstats.com as a self-service. Nothing to store on your own.
- rtcstats-js + rtcstats-server - you operate from your infrastructure and want to keep call information and metadata here.
Setup
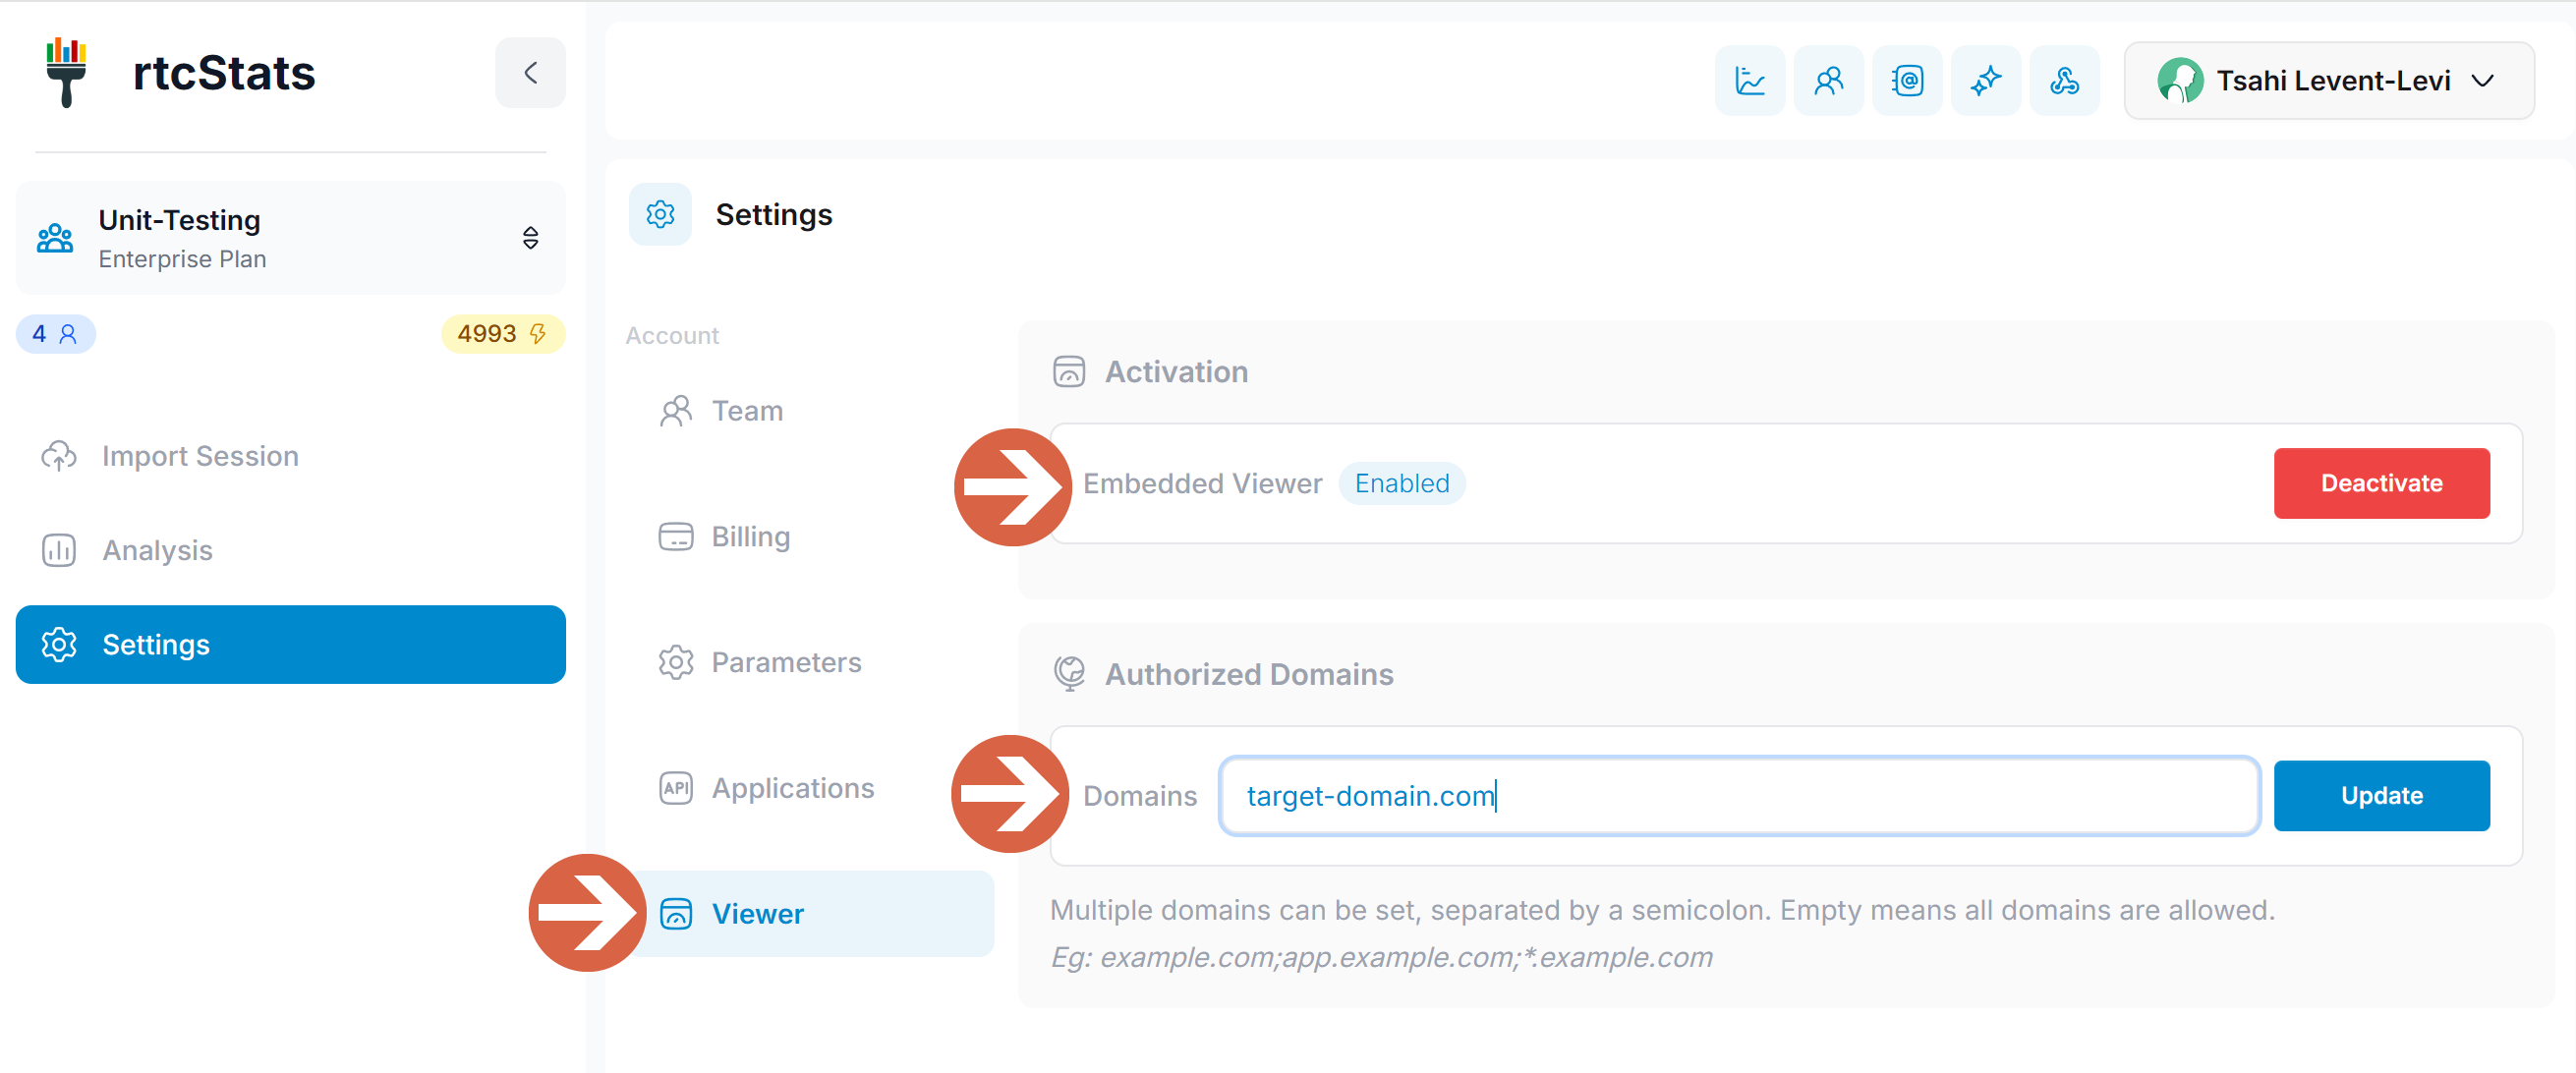
For embedding to work, you first need to have 3 things configured on rtcstats.com:
- Have an Enterprise plan (see pricing)
- In Settings | Viewer set Activation to Enabled
- Under Authorization Domains, make sure to place the domain in which you plan on embedding the viewer
Note: The above settings are only visible to the account's Owner and Admin user roles.
Once the above setup is complete, you can get any of the files uploaded to rtcstats.com appear inside an iframe inside your own dashboard.
Use cases
- Support dashboards - let support agents view WebRTC session analysis alongside your ticket system without context switching
- Admin panels - embed session quality data directly into your application's admin interface
- QA workflows - integrate session analysis into your testing and QA pipelines
Questions?
Interested in the embeddable viewer? Contact us to learn more or to get started with an Enterprise plan.
Was this page helpful?
