What file formats can I upload?
Supported file formats for uploading and analyzing WebRTC session data in rtcstats.com.
rtcstats.com accepts multiple file formats for analysis.
Supported formats
webrtc-internals dump files
The most common format. These are generated by Chrome's built-in chrome://webrtc-internals tool.
Today, Chrome also supports rtcstats format, which is our preferred file format.
- If a user sends you a webrtc-internals dump file, that's fine - just upload it to rtcstats.com.
- If you have an alternative, always prefer the rtcstats format instead
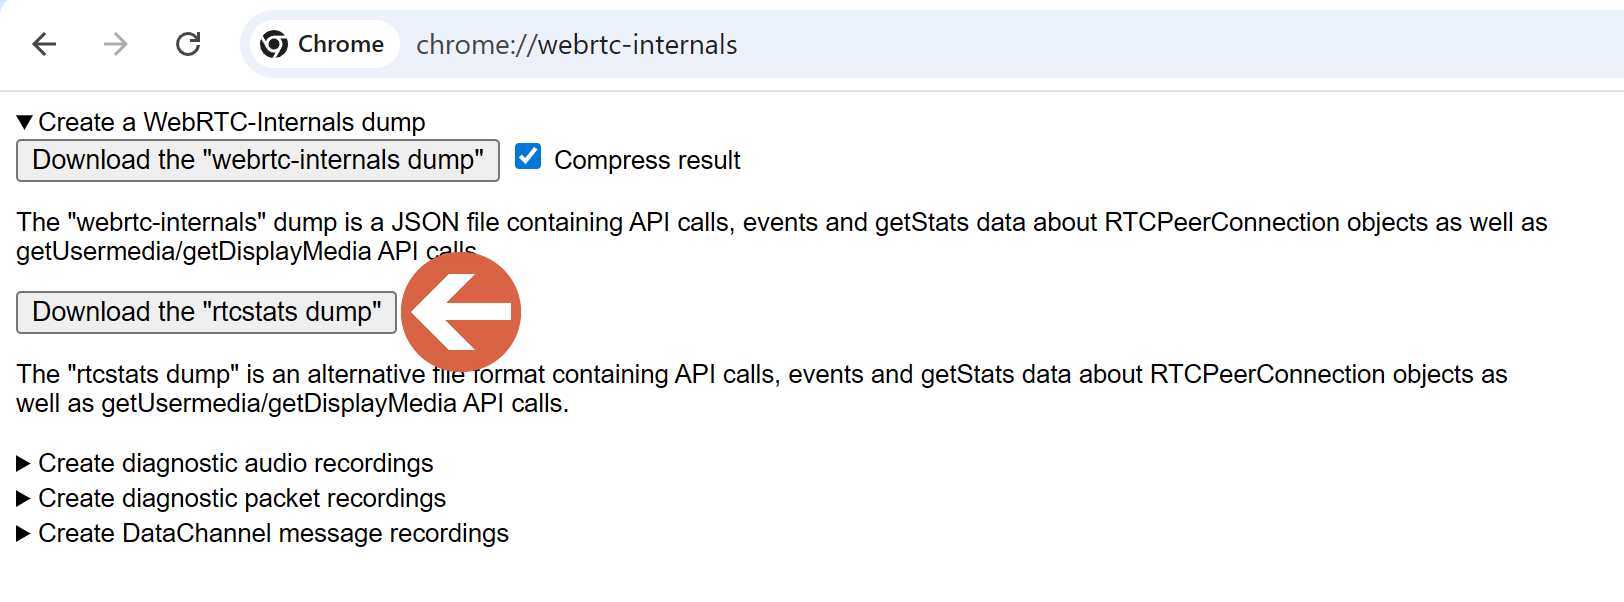
rtcstats format
These are files collected by rtcstats-server from the rtcstats.js SDK or via direct download from Chrome's webrtc-internals tab. These files contain the same getStats() data along with additional trace events (ICE candidates, SDP offers/answers, state changes, device information).
rtcstats dump files are the preferred file format by rtcstats.com.
File size limits
Based on the plan you use, you will be limited by the size of file you can upload to rtcstats.com.
If you need to support bigger file sizes, be sure to move to one of our paid plans.
What about compressed files?
You can download the compressed files Chrome generates and upload them directly to rtcstats.com.
Don't compress these files yourself - such an approach will likely fail.
Tips for getting the best analysis
- Let the session run - very short sessions (a few seconds) may not have enough data for meaningful analysis. Aim for 1 or more minutes
- Don't truncate the dump - webrtc-internals dump files include cumulative counters. Partial files may produce inaccurate calculations
- Include the full session - if possible, start the dump before the call begins and stop it after the call ends. If you are downloading the file manually from the browser, this means opening the chrome://webrtc-internals tab before starting the call
- Stay on webrtc-internals tab - this one is nagging… if you run long sessions (30-60 seconds or more), Chrome may throttle and put the webrtc-internals tab to sleep, which means it won't collect metrics for long periods of time. Be sure to have your browser opened on the webrtc-internals tab, or go back to it every couple of seconds. This is nagging, but necessary. Our best suggestion is to integrate rtcstats-js instead
See also
- Credits in rtcStats - each upload consumes one credit
Was this page helpful?
